

Non-waterfront and waterfront sales hit multi-year highs in March
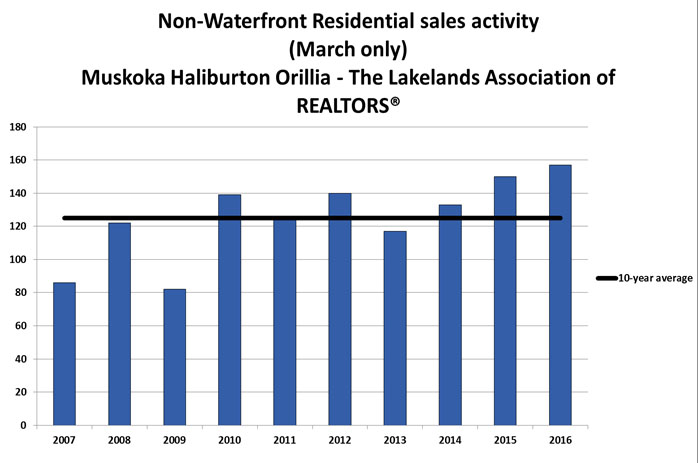
Residential non-waterfront sales activity recorded through the MLS® system of Muskoka Haliburton Orillia – The Lakelands Association of REALTORS® numbered 157 units in March 2016, up 4.7 per cent from March 2015.
On a year-to-date basis non-waterfront sales were running 7.7 per cent ahead of the first quarter of 2015.
Sales of waterfront properties jumped 28.8 per cent year-over-year to 85 units in March 2016.
On a year-to-date basis waterfront sales were up 17.4 per cent from the first quarter of 2015.
“Demand for both waterfront and non-waterfront properties was extremely strong in March, with sales of both hitting their highest levels in more than a decade,” said Tom Wilkinson, President of Muskoka Haliburton Orillia – The Lakelands Association of REALTORS®. “Rising sales combined with falling supply appear to be putting some upward pressure on prices.”
The median price for residential non-waterfront property sales was a record $253,000 in March 2016, up 10.4 per cent from March 2015.
The median price for waterfront sales was $425,000 in March 2016, rising 21.6 per cent from March 2015.
The dollar value of all residential non-waterfront sales in March 2016 totalled $40.8 million, rising 10.3 per cent from March 2015. This was the best March level on record.
The total value of waterfront sales was $60.1 million, more than double March of last year and a record for the month. This was such a strong March showing that it marked the first time volumes had surpassed even $30 million in this month.
| Summary – Sales by Housing Type | |||
|---|---|---|---|
| Category | March 2016 | March 2015 | Year-over-year percentage change |
| Non-Waterfront Residential | 157 | 150 | 4.7 |
| Waterfront | 85 | 66 | 28.8 |
| Includes transactions in all areas recorded by the REALTORS® Association of Ontario Lakelands | |||
| Summary – Median Price by Housing Type | |||
|---|---|---|---|
| Category | March 2016 | March 2015 | Year-over-year percentage change |
| Non-Waterfront Residential | $253,000 | $229,250 | 10.4 |
| Waterfront | $425,000 | $349,500 | 21.6 |
| Includes transactions in all areas recorded by the REALTORS® Association of Ontario Lakelands | |||
| Detailed – Non-Waterfront Residential Sales and Median Price by Area | ||||||
|---|---|---|---|---|---|---|
| Non-Waterfront Residential | ||||||
| By Area | Unit Sales | Median Sale Price | ||||
| March 2016 | March 2015 | Year-over-year percentage change |
March 2016 | March 2015 | Year-over-year percentage change |
|
| Muskoka | 83 | 61 | 36.1 | $223,000 | $205,000 | 8.8 |
| Haliburton | 14 | 10 | 40.0 | $164,500 | $214,250 | -23.2 |
| Orillia | 57 | 48 | 18.8 | $268,500 | $251,000 | 7.0 |
| Detailed – Waterfront Sales and Median Price by Area | ||||||
|---|---|---|---|---|---|---|
| Waterfront | ||||||
| By Area | Unit Sales | Median Sale Price | ||||
| March 2016 | March 2015 | Year-over-year percentage change |
March 2016 | March 2015 | Year-over-year percentage change |
|
| Muskoka | 46 | 44 | 4.5 | $482,500 | $358,750 | 34.5 |
| Haliburton | 24 | 13 | 84.6 | $388,750 | $365,000 | 6.5 |
| Orillia | 15 | 5 | 200.0 | $407,500 | $430,000 | -5.2 |