Non-waterfront sales climb to new February record
Residential non-waterfront sales activity recorded through the MLS® system of Muskoka Haliburton Orillia – The Lakelands Association of REALTORS® numbered 155 units in February 2017, up 18.3% from February 2016. This was a new record for the month.
On a year-to-date basis residential non-waterfront sales (249) were running 12.2% above the first two months of 2016. This was also a record for the period.
Sales of waterfront properties rose 12.8% to 44 units in February 2017. This was above both the five and 10-year averages for the month and the highest since 2002.
On a year-to-date basis waterfront sales were up 1.2% from the same period in 2016. This was also the highest since 2002.
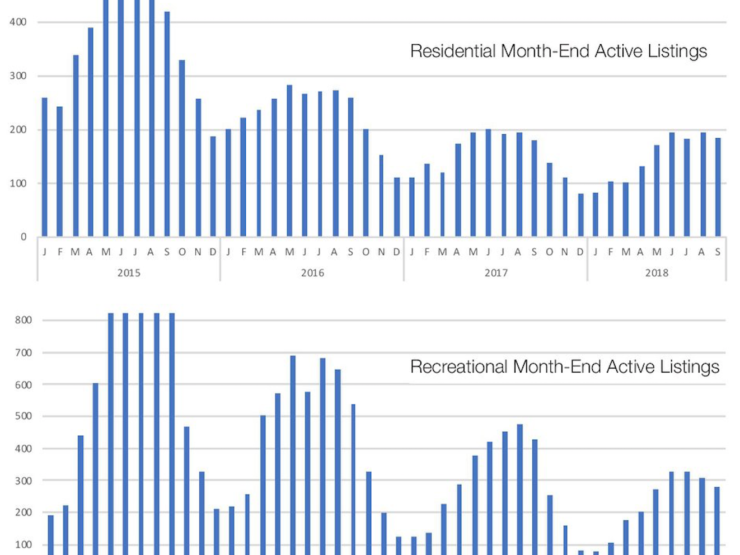
“Non-waterfront sales activity has started 2017 at a record-breaking pace, and waterfront sales are running at a 15-year high,” said Mike Taylor, President of Muskoka Haliburton Orillia – The Lakelands Association of REALTORS®. “Supply continues to fall, which is leading to an acceleration in prices for those listings that are for sale. Should currently trends persist, that shortage of supply could potentially also start to bite into those record sales figures.”
The median price for residential non-waterfront property sales was a record $315,000 in February 2017, jumping 39.4% from February 2016.
The median price for waterfront sales was $386,250 in February 2017, rising 24.4% from February 2016.
The dollar value of all residential non-waterfront sales in February 2017 totalled $51.8 million, leaping 61.8% from February 2016. This was a record for the month of February and marked the first February to reach more than $40 million.
The total value of waterfront sales was $19.6 million, edging down 2.2% from February last year.
| Summary – Sales by Housing Type | |||
|---|---|---|---|
| Category | February 2017 | February 2016 | Year-over-year percentage change |
| Non-Waterfront Residential | 155 | 131 | 18.3 |
| Waterfront | 44 | 39 | 12.8 |
| Includes transactions in all areas recorded by Muskoka Haliburton Orillia – The Lakelands Association of REALTORS® | |||
| Summary – Median Price by Housing Type | |||
|---|---|---|---|
| Category | February 2017 | February 2016 | Year-over-year percentage change |
| Non-Waterfront Residential | $315,000 | $226,000 | 39.4 |
| Waterfront | $386,250 | $310,500 | 24.4 |
| Includes transactions in all areas recorded by Muskoka Haliburton Orillia – The Lakelands Association of REALTORS® | |||
| Detailed – Non-Waterfront Residential Sales and Median Price by Area | ||||||
|---|---|---|---|---|---|---|
| Non-Waterfront Residential | ||||||
| By Area | Unit Sales | Median Sale Price | ||||
| February 2017 | February 2016 | Year-over-year percentage change |
February 2017 | February 2016 | Year-over-year percentage change |
|
| Muskoka | 82 | 59 | 39.0 | $270,500 | $190,000 | 42.4 |
| Haliburton | 6 | 8 | -25.0 | $216,500 | $181,250 | 19.4 |
| Orillia | 63 | 62 | 1.6 | $328,900 | $259,900 | 26.5 |
| All Other Areas | 4 | 2 | 100.0 | $377,500 | $309,000 | 22.2 |
| Note: A percentage change of — indicates there were no sales in the same month one year ago. | ||||||
| Detailed – Waterfront Sales and Median Price by Area | ||||||
|---|---|---|---|---|---|---|
| Waterfront | ||||||
| By Area | Unit Sales | Median Sale Price | ||||
| February 2017 | February 2016 | Year-over-year percentage change |
February 2017 | February 2016 | Year-over-year percentage change |
|
| Muskoka | 24 | 27 | -11.1 | $395,000 | $310,500 | 27.2 |
| Haliburton | 10 | 4 | 150.0 | $254,500 | $228,500 | 11.4 |
| Orillia | 8 | 8 | 0.0 | $629,950 | $387,500 | 62.6 |
| All Other Areas | 2 | 0 | — | $428,750 | $0 | — |
| Note: A percentage change of — indicates there were no sales in the same month one year ago. | ||||||


